In recent years, asset-heavy industries like manufacturing, oil and gas, and aerospace & defense have become increasingly interested in “digital twins”, or software-based representations of real-world assets. The promise of digital twins is to enable operators and engineers to more accurately simulate and model asset behavior, unlocking high-value use cases such as predictive maintenance and yield optimization.
But implementing digital twins is technically complex. Integrating and correlating all asset-related data, including engineering diagrams and sensor, operational, and maintenance data, in order to power data-driven digital twins continues to elude most of the software companies and asset manufacturers that pursue these projects.
C3.ai, which has a decade of experience delivering AI-enabled applications to utilities, manufacturers, and energy companies for a range of asset optimization use cases, has developed a proprietary methodology for capturing asset data locked in engineering diagrams to facilitate the creation of digital twins. Read about the methodology in-depth below.
The first step in building a data-driven application is to develop a unified data model that integrates and correlates data from enterprise and operational datastores. For asset-intensive operators—like power, petrochemicals, and oil and gas companies—a unified data model requires an underlying asset hierarchy that models the relationships between equipment and the IoT sensors (or tags) that monitor them. Once equipment and related sensor data is correlated, data scientists can develop AI models to predict failures, optimize set-points, and otherwise improve asset operations.
A challenge faced by dozens of our customers, however, is that asset hierarchy information is trapped in static (often physical) engineering diagrams rather than in computer-readable databases that could be easily leveraged to build the requisite data models.
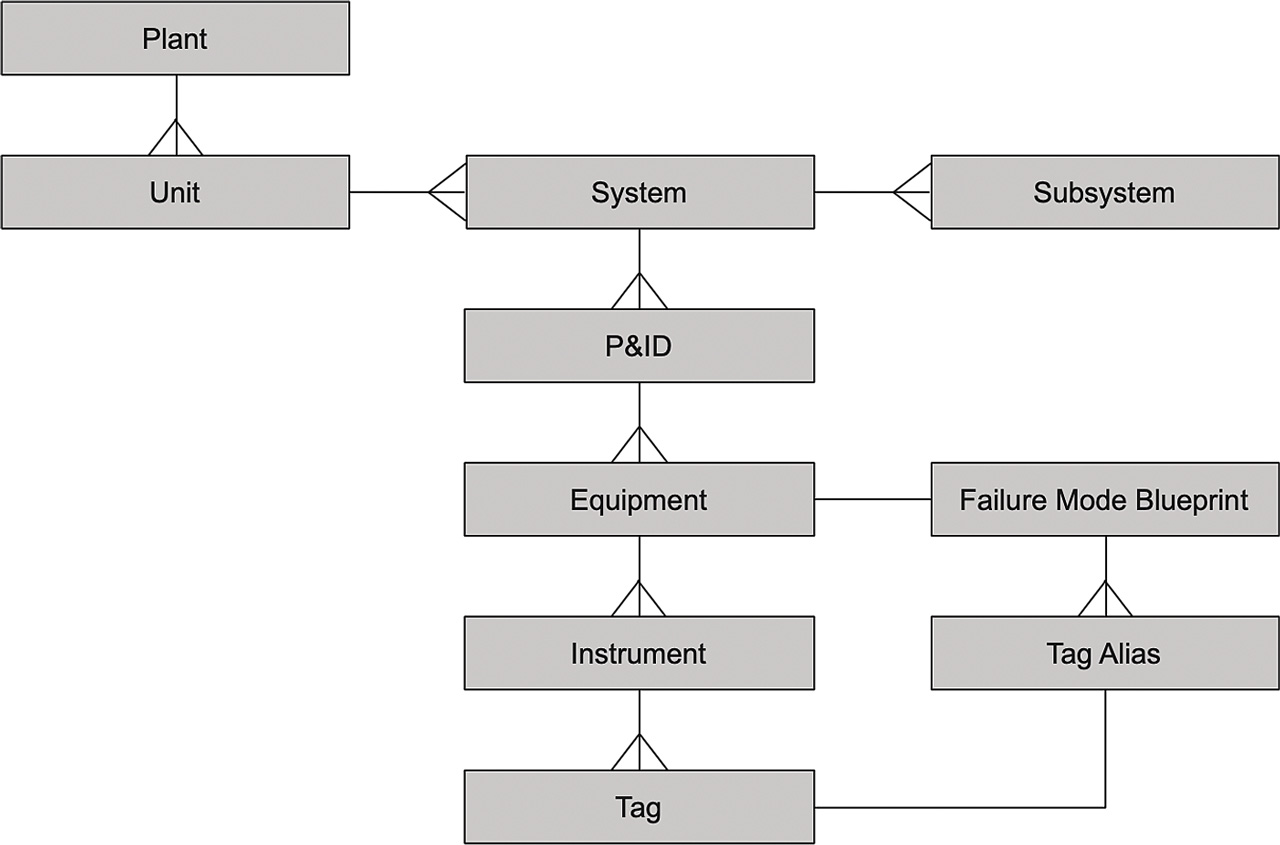
Figure 1 – The asset hierarchy required for representing a processing plant with references to external databases containing tags and failure mode libraries
P&ID Diagrams
The information required to create asset hierarchies is usually contained within engineering documents such as piping and instrumentation diagrams (P&IDs). These diagrams are typically physical documents or images with limited metadata. In the past, enterprises have attempted to create asset hierarchies by inspecting P&IDs and manually assigning each tag to equipment and to external databases (see Figure 1 for an example output). This process, commonly referred to as tag mapping, is costly; one customer mentioned devoting over 1,000 engineering hours to mapping tags within a single petrochemical plant. Because it is a manual process, it is prone to errors. And because such mappings require manual updates when plant equipment and tags are removed or replaced, mappings become outdated quickly.
The advent of next-generation AI applications for plant optimization has made it abundantly clear that operators need a productized, scalable, and automated solution for asset hierarchy digitization and maintenance.
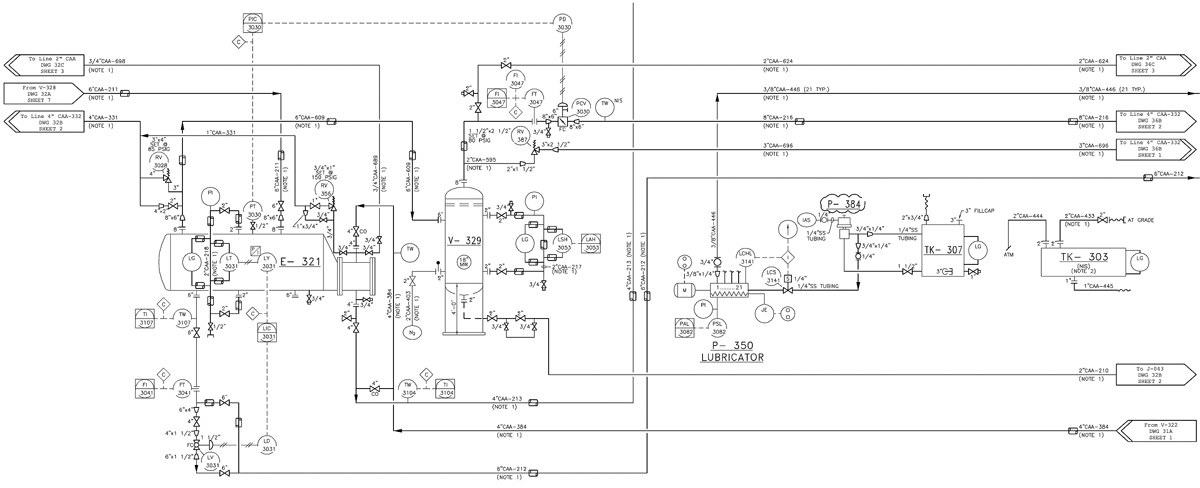
Figure 2 – A piping and instrumentation diagram, or P&ID, contains valuable information that shows the relationships between equipment, instruments, and sensors but is typically not machine-readable. Manual inspection of these diagrams to create asset hierarchies that incorporate tags is time-consuming and prone to error
Using AI to Map Tags
To solve this problem, C3.ai has developed an industry-leading, patent-pending capability to digitally parse P&IDs and map tags within large processing plants. By leveraging computer vision, natural language processing, and graph search techniques, we have automated the retrieval of information from any unstructured data source (such as engineering diagrams).
A three-step process powers our automatic diagram parsing capability:
- A convolutional neural network, shown in Figure 3, detects common symbols (such as tags) in the diagram with over 90 percent precision1 and recall2.
- A pre-trained text detection network identifies text in the diagram and parses the detected text using Tesseract OCR.
- A graph search traverses the diagram through its lines, discovering interconnected symbols and mapping tags to equipment automatically. The results of the symbol detection and text detection steps are shown in Figure 4.
Technical details can be found in our paper Automatic Digitization of Engineering Diagrams using Deep Learning and Graph Search, presented at the world’s premier computer vision conference, Computer Vision and Pattern Recognition 2020.
Figure 3 – We trained a convolutional neural network with a LeNet architecture to detect and classify common symbols in the diagram
Customers can train and deploy deep learning models automatically through composable ML pipelines in the C3 AI™ Suite to detect symbols both from a large out-of-the-box library and from their own libraries.
By parsing the engineering diagrams, the C3.ai product automatically generates structured hierarchies that allow customers to unify equipment, sensors, and tags and to represent their assets digitally. The automatic generation of asset hierarchies saves thousands of hours in manual work while enabling enterprises to deliver high-value applications – including predictive maintenance and yield optimization – orders of magnitude more quickly than would be possible otherwise. We have found through our customer work that facility mapping with the C3.ai product is 10 to 25 times faster than without.
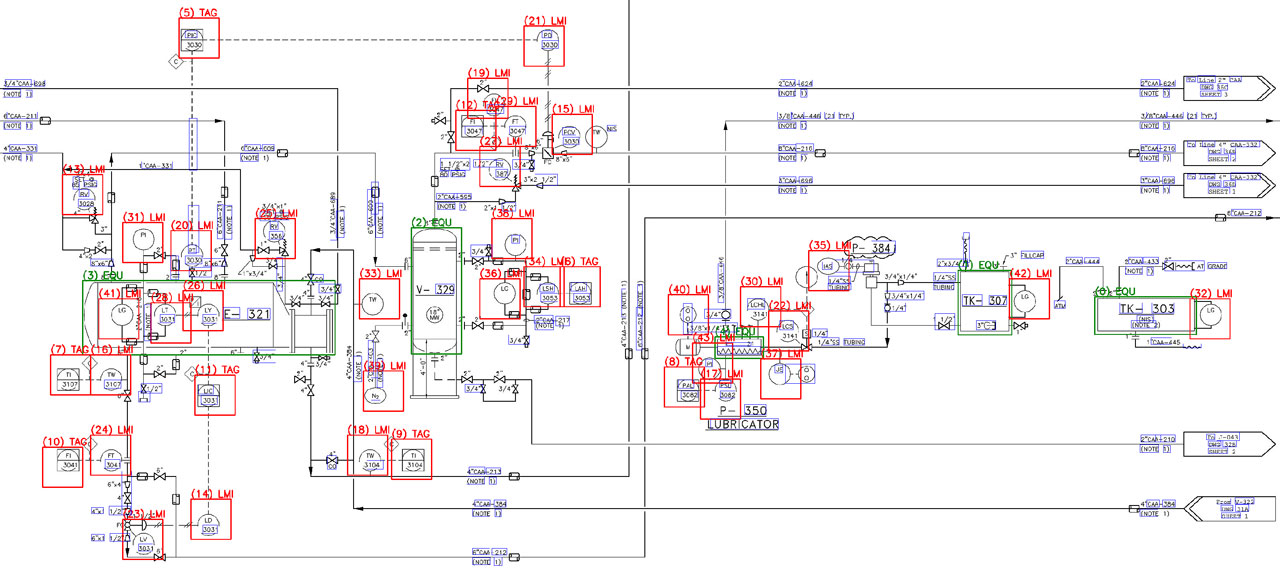
Figure 4 – In this P&ID, we have automatically detected locally mounted instruments (LMIs), tags, equipment, and the associated text
Diagram parsing not only accelerates initial mapping, but also enables engineers and operators to query diagrams for troubleshooting and root cause analysis. Detailed tag mapping also ensures accurate assignment of tags to the proper equipment inlets and outlets, improving the usefulness of failure mode libraries for diagnostics.
C3 AI Digital Twin
C3.ai is making this capability available as part of our soon-to-be-launched C3 AI Digital Twin SaaS application. With C3 AI Digital Twin, users will be able to accelerate the creation of digital twins through a self-service, project-based user experience. Watch the webinar “Using AI to Transform Manufacturing in the Post-COVID World” or visit our manufacturing industry page for more details.
1Precision = Accurate detections/total detections
2Recall = Symbols detected/total symbols

