Tracking Customer Engagement
Challenge
Tracking customer response rates to marketing campaigns was a manual process for this large U.S. utility. The utility engaged with millions of customers multiple times per day – to achieve energy savings targets, promote rebates / programs, etc. Understanding which customers responded to individual marketing campaigns required pulling data from six enterprise datastores, including Oracle, an in-house Enterprise Data Warehouse, and more. Connecting to each datastore, blending the data together, and analyzing millions of rows of customers required hours of multiple analysts’ time. The utility needed a quick and easy way to measure customer response rates.
Approach
The utility looked to C3 AI Ex Machina to reduce reporting timelines. In a matter of hours, the utility’s analysts collaborated to deploy a C3 AI Ex Machina workflow – depicted below – that reduced the reporting cycle to minutes.

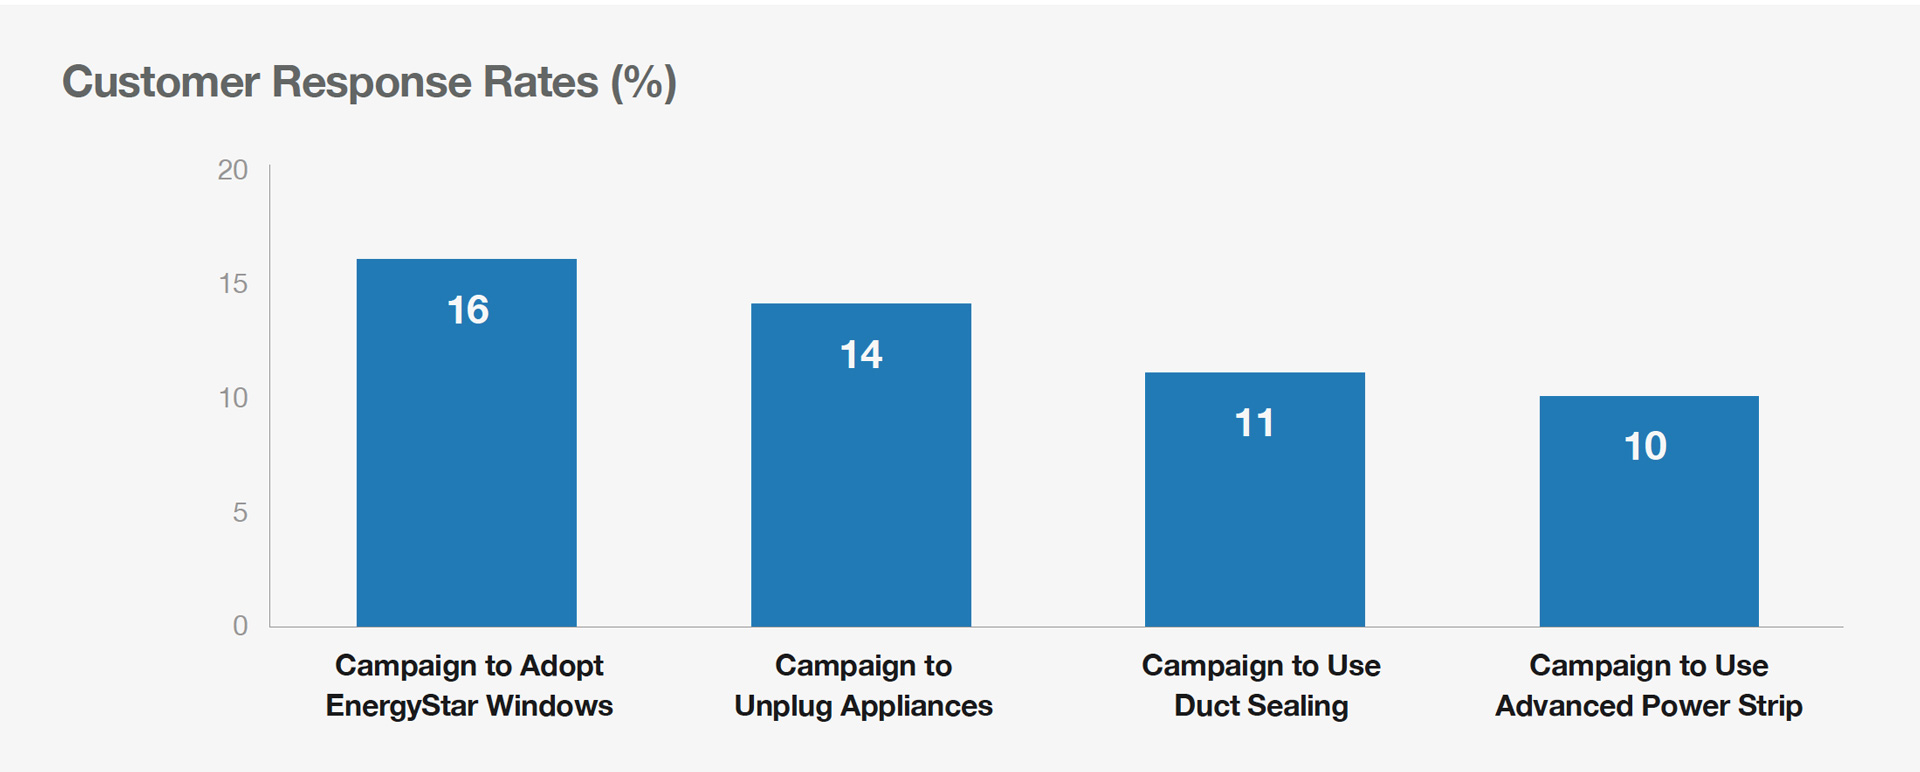
The solution fetches hundreds of thousands of rows of customer and marketing campaign data from the C3 AI Platform and joins the information into a unified dataset. Furthermore, analysts quickly identify the marketing campaigns recently sent to each customer by writing a simple SQL query in C3 AI Ex Machina. After cleaning the unified, joined, filtered dataset, analysts use a pivot operation to summarize customer response rates by campain and visualize the customer response rates in a histogram.

In future versions of the workflow, business analysts may choose to further understand customers by using a machine learning algorithm to perform customer segmentation in C3 AI Ex Machina. An analyst could train a clustering algorithm – such as a K-means algorithm – to group customers with similar demographics. The analyst could then assess which groups, or segments, are more likely to respond to a specific marketing campaign.
Business analysts could then write the segmentation results back to an enterprise CRM system such as Salesforce so that the Marketing team could access real-time data on a customer’s likelihood to respond to a campaign.
Results
- C3 AI Ex Machina workflow configured in hours
- Connected to six enterprise datastores containing information on over 100,000 customers across the United States
- Rapidly blended and prepared data
- Added configurations to enhance the flexibility of the reporting pipeline, such as time-window of interest
- Utilized C3 AI Ex Machina histogram visualization to quickly understand customer response rates
- Schedule and run workflow daily to generate histogram and share broadly across Marketing organization


